
Energy monitoring and analysis software for industry
Zainergy EMS reads every energy meter on your site once a minute, shows where the power and the money go, and warns you before a demand peak or a PF penalty reaches your bill.
- Real-time visibility
- Alerts before the bill
- AI-powered insights
Load today, kW per hour
Energy sources
- Grid 62%
- Solar 30%
- Genset 8%
Carbon footprint
8.9 t
CO₂ today, 2.1 t avoided by solar
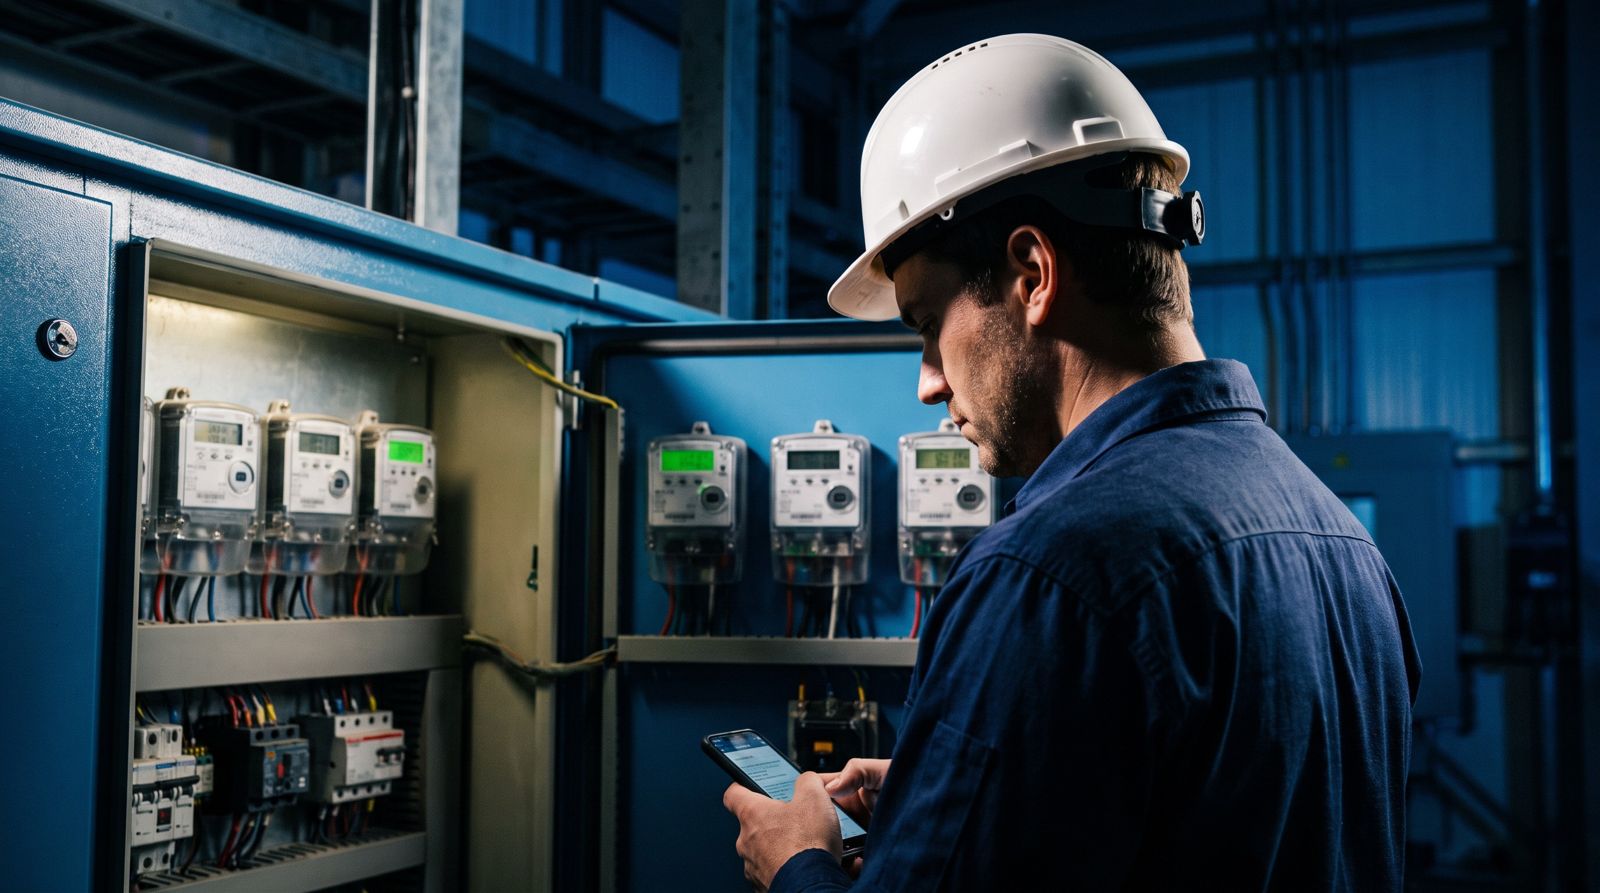
Reads the energy meters, analyzers and inverters you already have, from 26 brands
Why choose Zainergy EMS
One platform for the people who pay the bill, run the plant and maintain the switchgear.
Real-time analysis
Live load, voltage, PF, harmonics and solar from every panel, every minute, so waste and faults show up the same day.
Proof on the bill
Compare utility bills with your own meters, track the peak of every billing month and show the saving in rupees.
Share with your team
Logins per site, printable reports and CSV downloads for managers, engineers and finance.
Works with your meters
53 ready models from 26 brands over RS485 Modbus. No need to replace what is in your panels.
How it works
From the meter in your panel to a decision on your phone.
Connect your meters
We fit a Zainergy gateway on the RS485 line. It finds each meter by itself and sends its readings securely to our cloud. Your team sets the site's Wi-Fi from a phone.
- No servers on site
- Settings and updates done remotely
- Each gateway has its own security certificate
Analyse every source
See grid, solar and genset side by side, per site and per meter, and how each day compares with what your solar plant should give.
- Energy and cost per meter, hour and department
- Solar generation against expected
- Carbon footprint and CO₂ avoided
Grid, solar and genset today
- Grid 58%
- Solar 36%
- Genset 6%
Daily generation against expected
Act before it costs you
The running 30-minute demand block is projected every minute. When it heads over your target, an alert appears at the top of every page while there is still time to shed load.
- Alerts on any reading with your own limits
- Silent meters flagged within minutes
- Ten highest blocks of every billing month
30-minute blocks, today
Ten highest blocks
| Time | kW |
|---|---|
| 3 Nov 11:00 | 1,372 |
| 3 Nov 11:30 | 1,360 |
| 2 Nov 15:30 | 1,331 |
Prove and report
Print reports under your own name: power quality to EN 50160 and IEEE 519, PF plant performance, maximum demand, and AI-written summaries of what to do next.
- Compliance tables, pass or fail
- Active harmonic filter and capacitor sizing
- CSV under every chart
Current harmonics, % of fundamental
Compliance
| EN 50160 voltage THD | PASS |
| IEEE 519 voltage THD | PASS |
| IEEE 519 TDD | FAIL |
Everything you need to manage industrial energy
- Real-time visibility of every meter, site and source
- Maximum demand, PF plant and power quality built in, not extra tools
- Bills checked against your own meters
- Works with the meters and switchgear you already have
- Dashboards for engineers, summaries for managers, the same figures for both
- Web and mobile app, with alerts always at the top
Modules for every energy question
Every plan includes the core monitoring. The modules answer the questions that cost the most.
Maximum demand
30-minute blocks, targets and live alerts.
PF plant
Capacitor bank performance, penalties and sizing.
Power quality
Harmonics, TDD and filter sizing to EN 50160 and IEEE 519.
Solar and net metering
Grid, solar and genset per site, and generation against expected.
Bills and cost
Utility bills read and compared with your meters.
Topology and 3D building
Your single-line and building, live.
Add-onAI report
Plain-language analysis and next steps.
Add-onVoice assistant
Ask your plant questions in Urdu or English.
Every energy problem has a measurable answer
What sites tell us costs them money, and what Zainergy EMS shows them instead.
High bills, no idea why
One bill for the whole site and no breakdown.
Cost per meter and per hour
Energy and cost for every feeder, line and department, from your own tariff.
Maximum demand surprises
One bad 30-minute block sets the demand charge for the month.
Warning while the block is running
A live projection every minute and an alert before the block closes over target.
Power factor penalties
The capacitor bank is installed, yet the penalty is still on the bill.
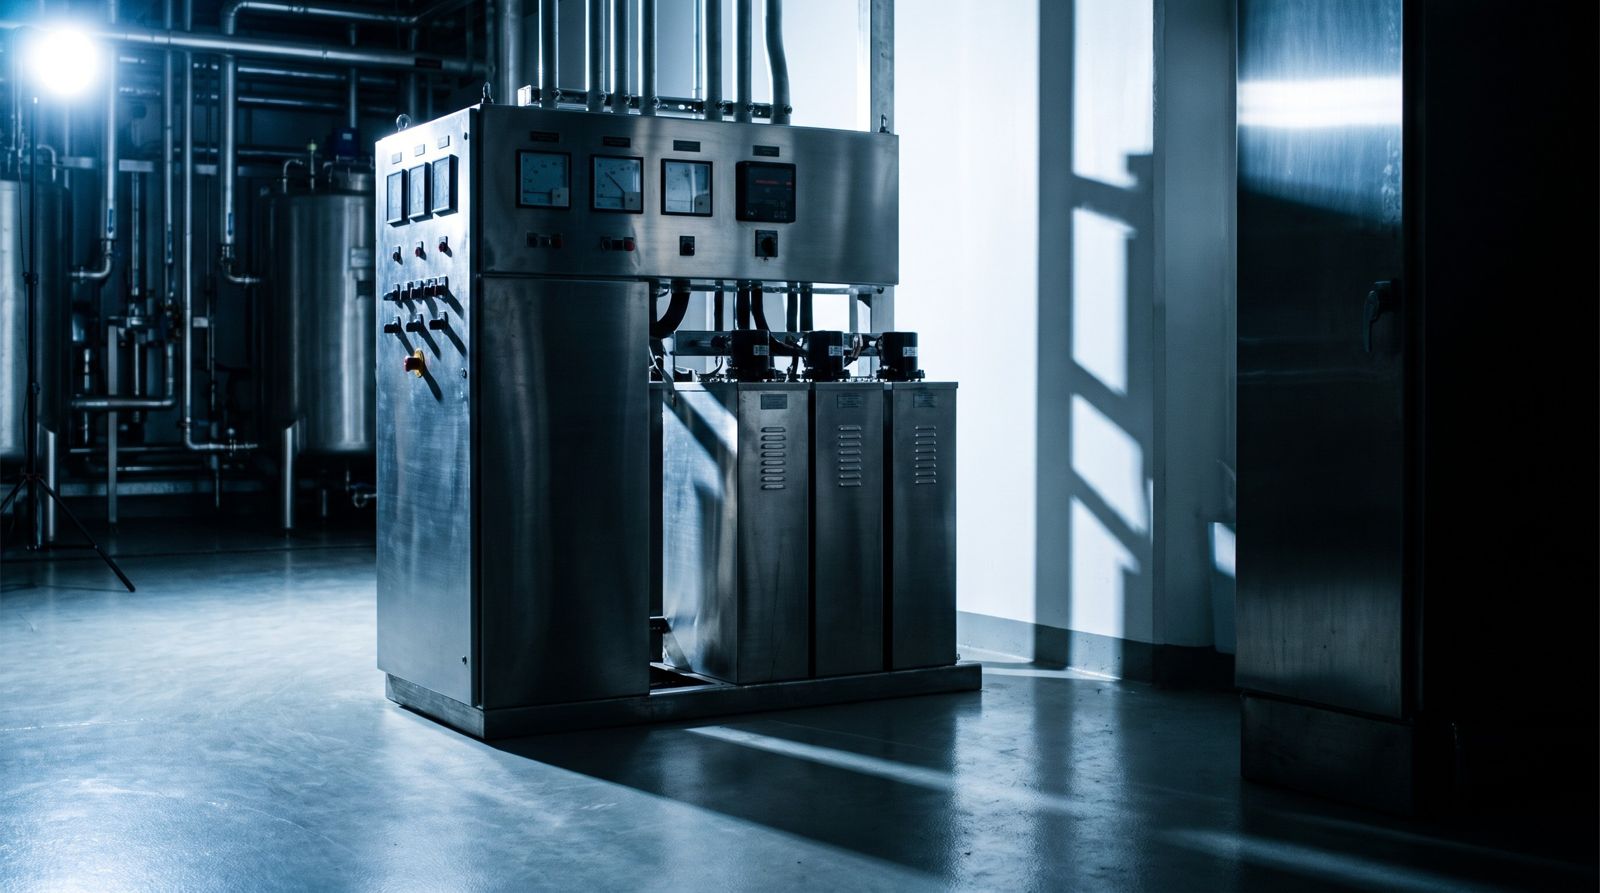
PF plant performance and sizing
PF as billed, the penalty it caused, bank output against nameplate and the right size.
Hidden harmonics
Hot cables, tripping drives and failing capacitors with no clear cause.
Power quality report
THD, TDD and harmonics to IEEE 519 and EN 50160, with active filter sizing.
Solar under-performing unseen
Panels get dusty, inverters trip, and nobody notices for weeks.
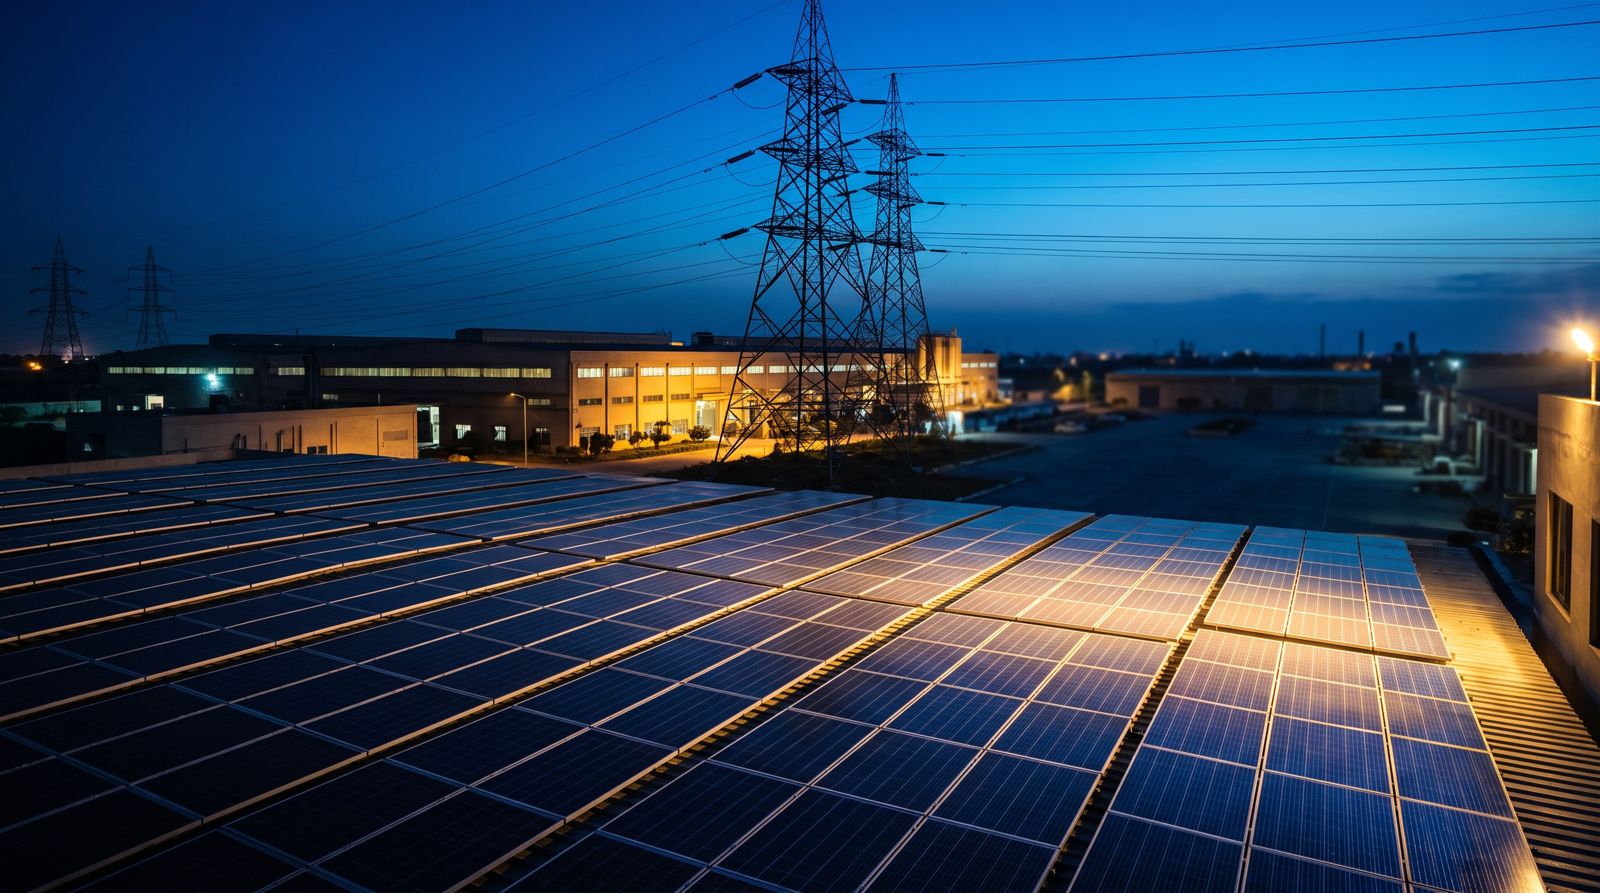
Generation against expected
Each site's daily solar against what its capacity should give, and the saving in rupees.
Built for every industry
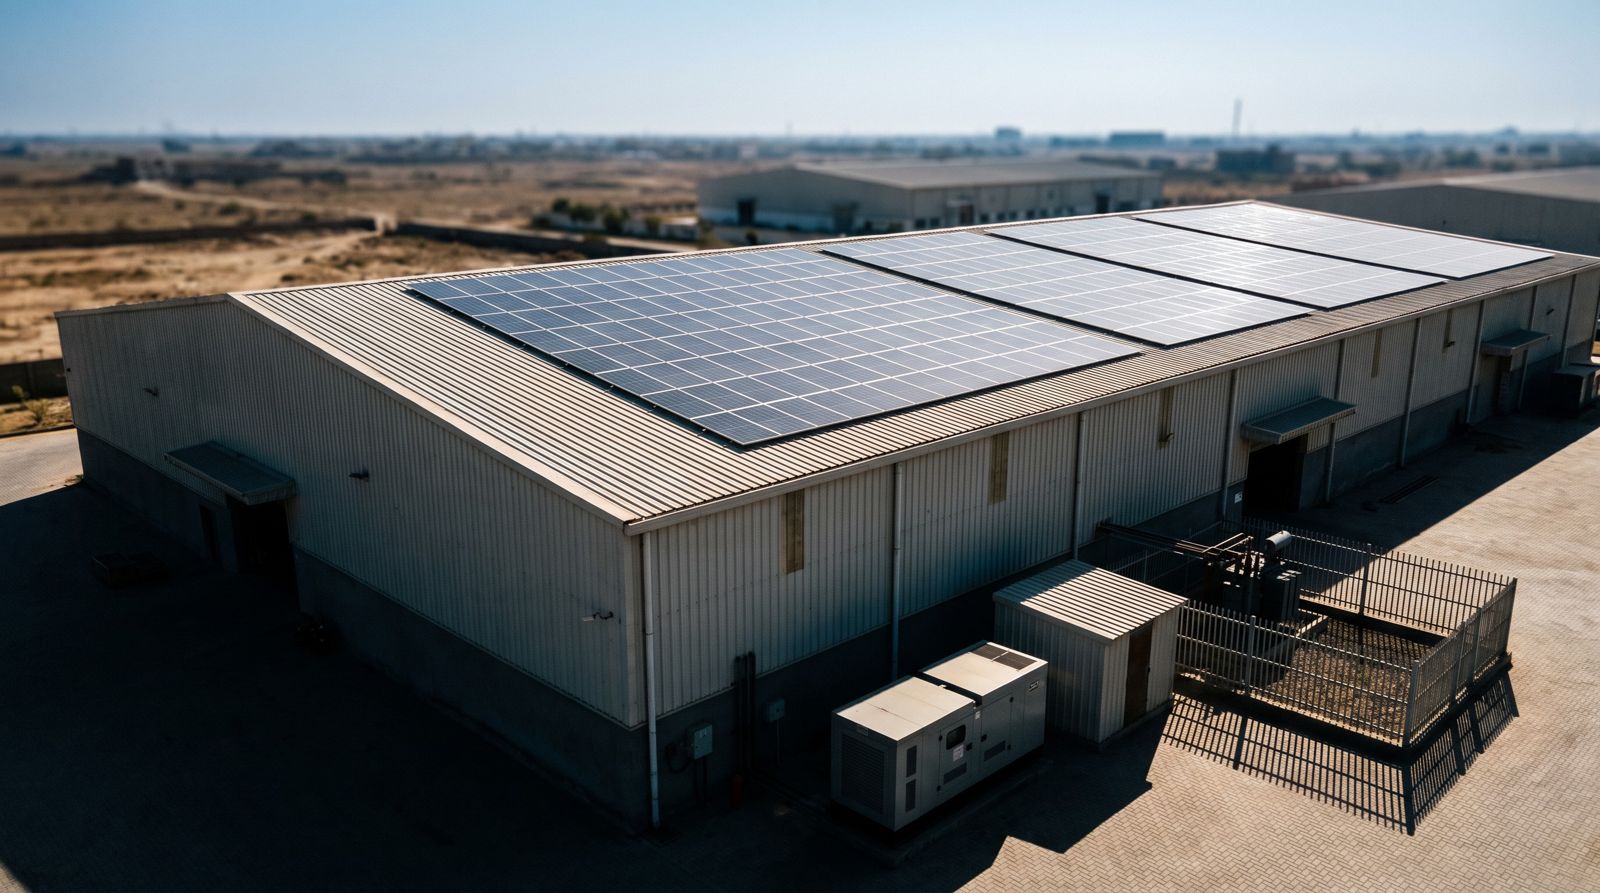
From spinning mills to cold stores, set up around how your site uses power.



Your plant in your pocket
The Zainergy EMS app opens on the figures that matter today, with alerts always at the top. Solar customers land straight on their solar page.
- Android and iOS, same features as the web
- Alert bar on every page: demand over target, meter offline, values out of range
- Several sites under one login, or a login limited to one site
- New features reach the app without a store update
Frequently asked questions
Something else? Ask us.
Do I need to replace my meters?
Usually not. The gateway reads the energy meters, analyzers and inverters already in your panels over RS485 Modbus. See the supported meters. If a panel has no meter, we supply one.
What can it monitor besides electricity?
Anything with a Modbus output on the same line: flow meters, tank level, temperature and humidity sensors, drives and smart breakers.
How does the data reach the cloud?
The gateway sends readings over the site's Wi-Fi to our cloud, encrypted, with its own security certificate. Each customer's data is kept apart, and only your logins can see it.
Does it switch loads or the genset by itself?
No. Zainergy EMS monitors, analyses and alerts. Your team decides what to switch, and the platform shows the result.
How long is my data kept?
Readings are never deleted. Your plan sets how far back the app shows: 12 months on Pro, 24 months on Pro Plus, longer on Enterprise.
Can it support ISO 50001 or ESG reporting?
It gives you the measured data those need: energy per site, meter and month, peaks, power factor, solar and an estimated carbon footprint.
Can I sell it under my own brand?
Yes. Partners get their own name, logo, colours, web address and a partner back office. See partners.